
Reviews

BECOME A FULL-TIME PROFESSIONAL TRADER.
Learn to Live & Breathe Market Cycles, and Trade for a Living.
Designed with beginners in mind, Pro Trader provides the precise information to get you on your way to becoming a self-sustaining full-time trader.
ULTIMATE ACCESS 🚀
The Essential Toolbox For Learning To Trade The Financial Markets & Become a Professional Trader
✔ Full Curriculum Available Immediately
$99 / month
LIMITED TIME OFFER
ONLY: $79 USD / month
*Educational content only. Not personal or general financial advice. We do not know your objectives, financial situation or needs. Trading leveraged products involves risk. Historical results shown are not a reliable indicator of future performance.*
Here's What You're Getting
✔ Pro Trader Curriculum Access
✔ 2 x Beginner Trading Strategies
✔ Trade Ideas & Private Slack Space
✔ Weekly Roundtable (Live)
✔ Weekly Market Review (Recorded)
PLUS: These Extra Bonuses
✔ Monthly Community Call
✔ Pro Trader Recording Archives
✔ 24/7 Live Meeting Room
✔ Special Event Invitations
$99 / month
LIMITED TIME OFFER
ONLY: $79 USD / month
$1 for first month then billed monthly at $79/USD.
Cancel at any time.

"Thanks to Luke's teaching, and dedication to this community, even a mum with a full-time job like me can enjoy the process of learning."
- Jane A 🇬🇧

"I started Pro Trader knowing absolutely nothing about trading, and now - just 5 months later - I'm using advanced day trading strategies and sitting my first prop firm challenge."
- Alexandra K 🇳🇿

"Truly amazing, professional and clean curriculum with a lot of 'as-you-go' coaching, live sessions, market analysis etc. Luke is one of the best teachers I've seen, ever."
- Tony J 🇬🇧


"Becoming a consistently profitable trader isn't easy, and it can take a really long time to get there. But learning from the right people combined with Pro Trader's over-the-shoulder style video curriculum, it's achievable in months, rather than years."
- Luke Lawson -
Founder & 12+ Year Trader
TRADE SMARTER WITH PRO TRADER
Our carefully constructed trading method has been refined over the past 10+ years with step-by-step breakdowns of past trades so you can study how professionals thought through real market moves.
1
🧭 UNDERSTANDING MARKET MOVEMENTS
With this foundation, you’ll be crystal clear on how to decode charts & predict price action using the 6 timeless technical analysis core principles.
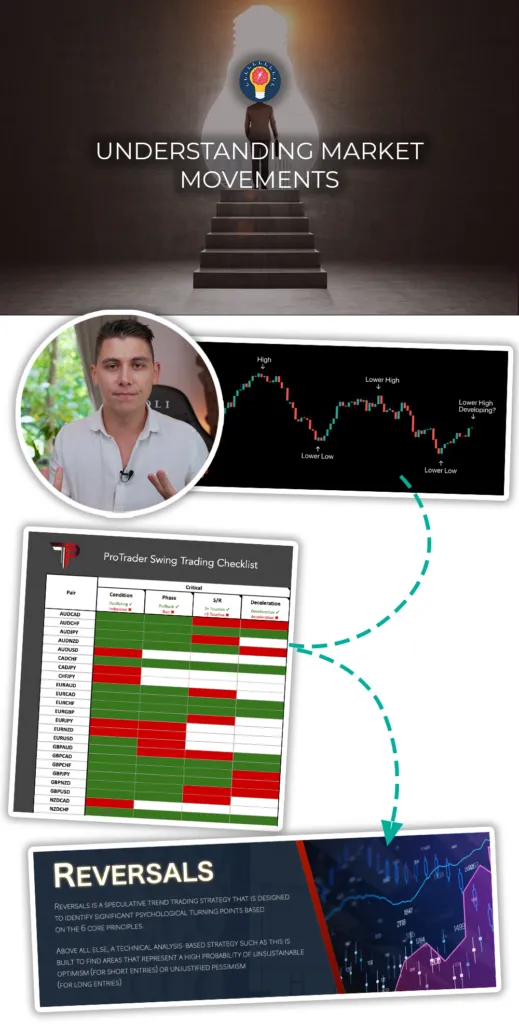
✅ Learn the 6 Core Principles that professionals have historically used to analyze price action.
Every profitable trader must first learn these principles.
✅ Learn how to properly risk manage and position size.
✅ Learn 2 beginner trading strategies, how to backtest them & build confidence in their profitability.
✅ Open a demo trading account and begin testing strategy performance.
✅ Practice the rules on a simulated account first; whether to trade live is your personal choice.
2
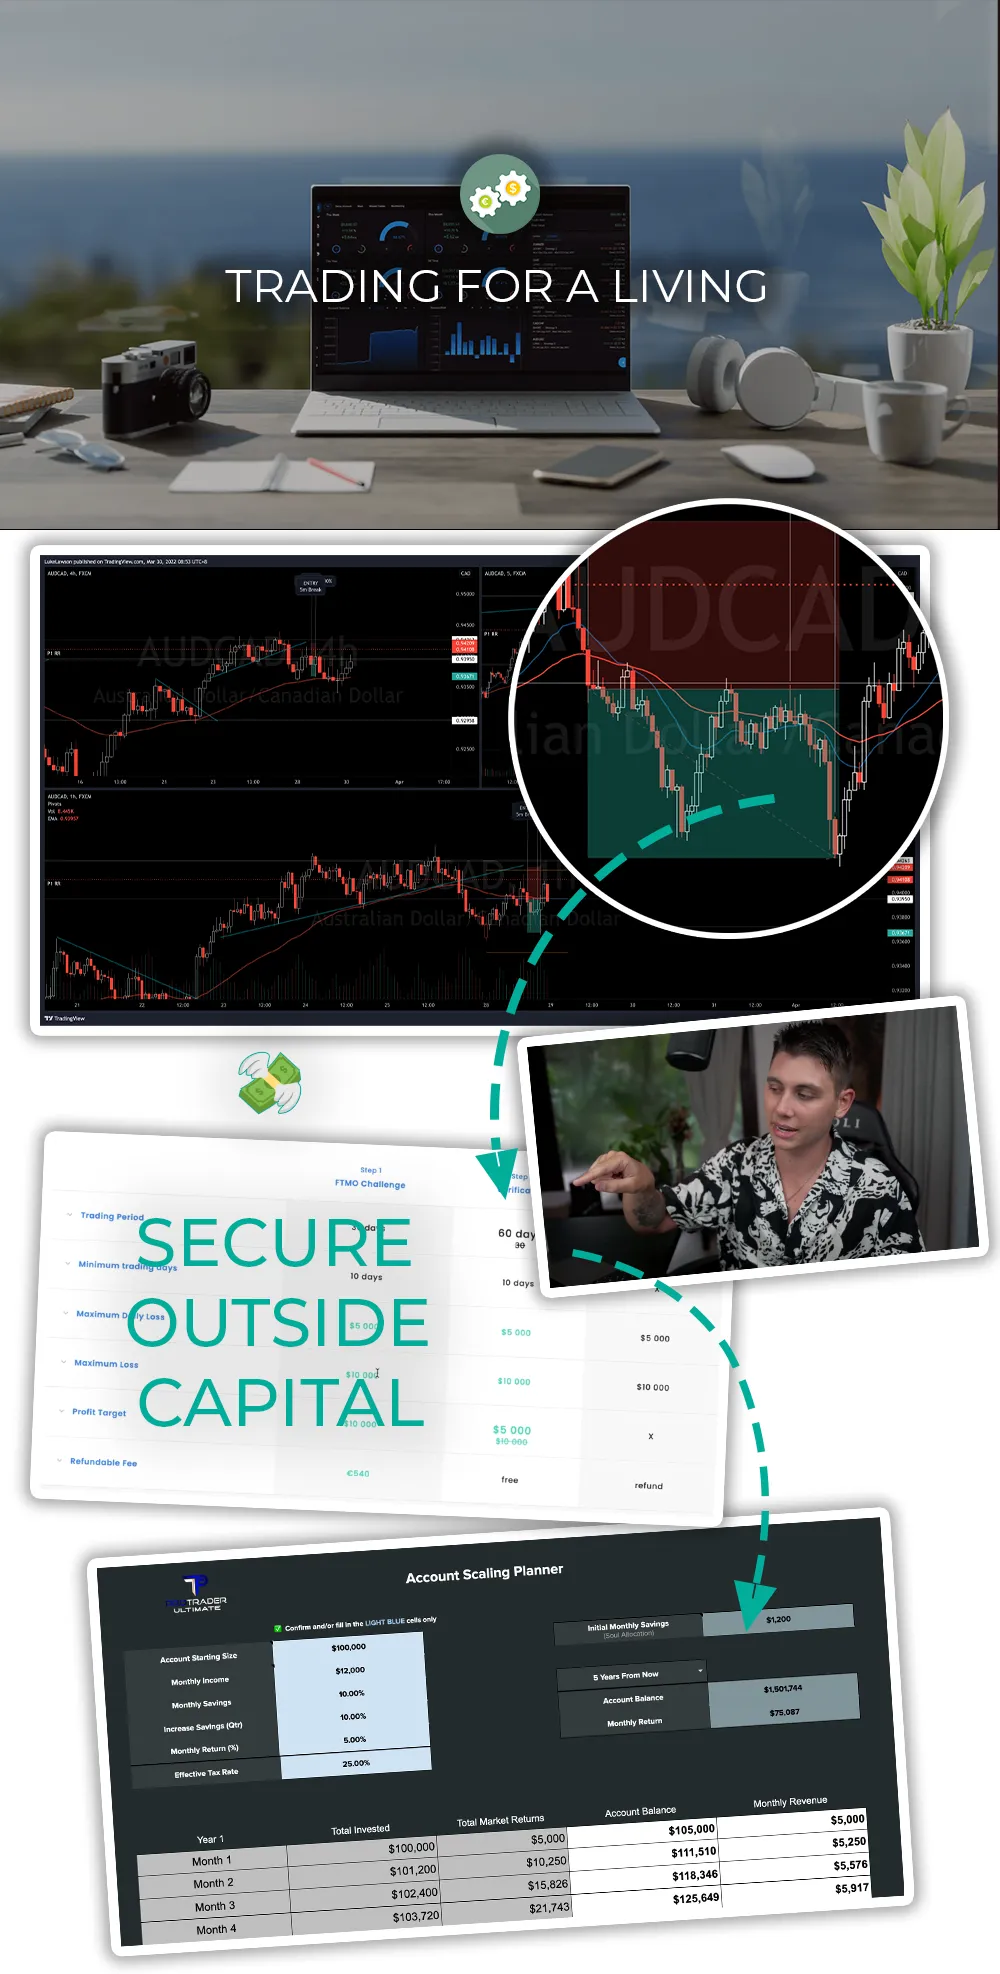
🏝 TRADING FOR A LIVING
Learn what it takes to become a full-time trader with a step by step guide to achieving whatever financial & life goals you set out to achieve.
✅ Achieve Stage 1 Financial Independence
**No need to rely on a boss or job to sustain your current standard of living.
✅ Introducing Multi-Timeframe Analysis and Day Trading!
✅ Master 2 x Day Trading strategies designed to capture intraday market moves.
✅ Leverage your skillset to secure outside capital from trading funds.
✅ Learn position-sizing frameworks that successful traders have used to scale their capital over years.
3
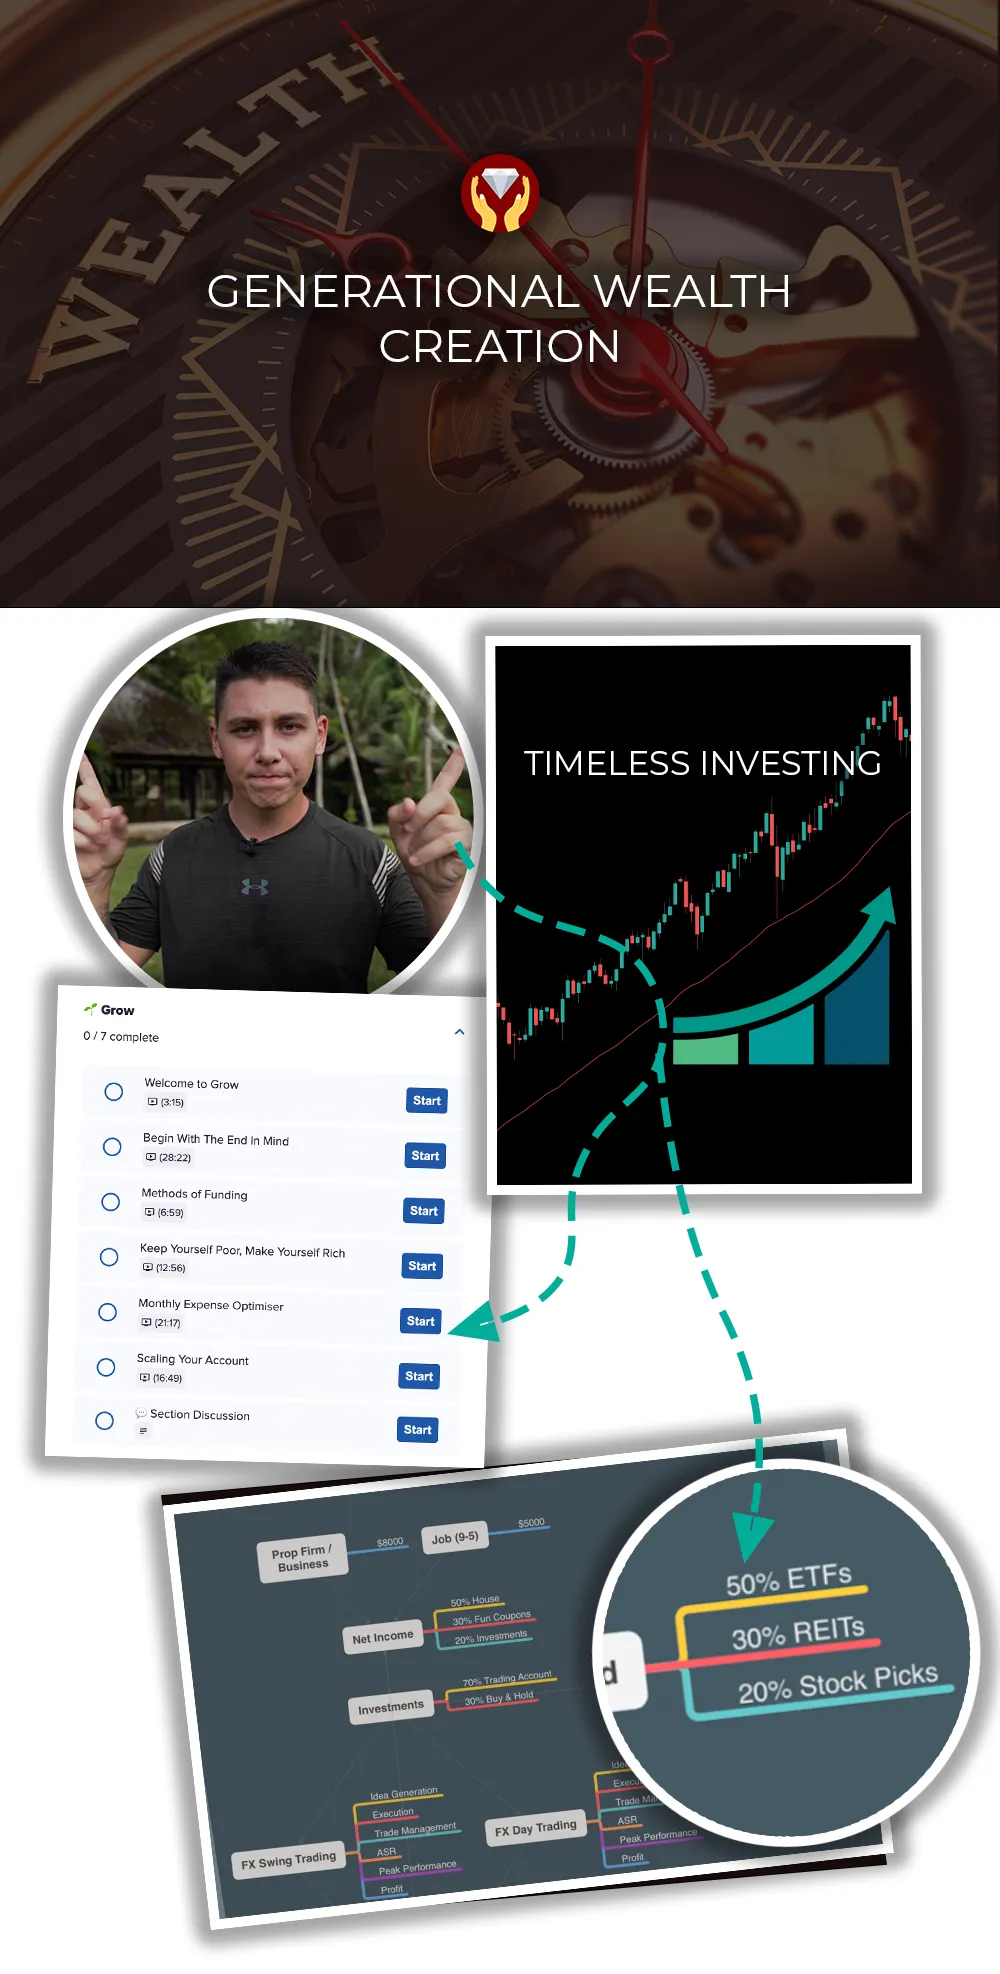
💎 GENERATIONAL WEALTH CREATION
Build a wealth empire using timeless investment strategies that will allow you to achieve Stage 2 Financial Independence that transcends your lifetime for your future generations.
✅ Harness the power of 4 x Institutional Grade trading strategies (advanced)
✅ Build a diversified wealth portfolio that will earn you consistent income independent of whether you show up to the charts or not, awake or asleep, alive or dead.
✅ Build a diversified wealth portfolio that will offer REAL security as you approach retirement (rather than a government pension!)
✅ Achieve Stage 2 Financial Independence* *Consistent income independent of if you show up to the charts or not, awake or asleep, transcends life & death.
💎 PLUS GET THESE ADDITIONAL BONUSES!
👥 MEMBERS GROUP
✔ Included in your membership
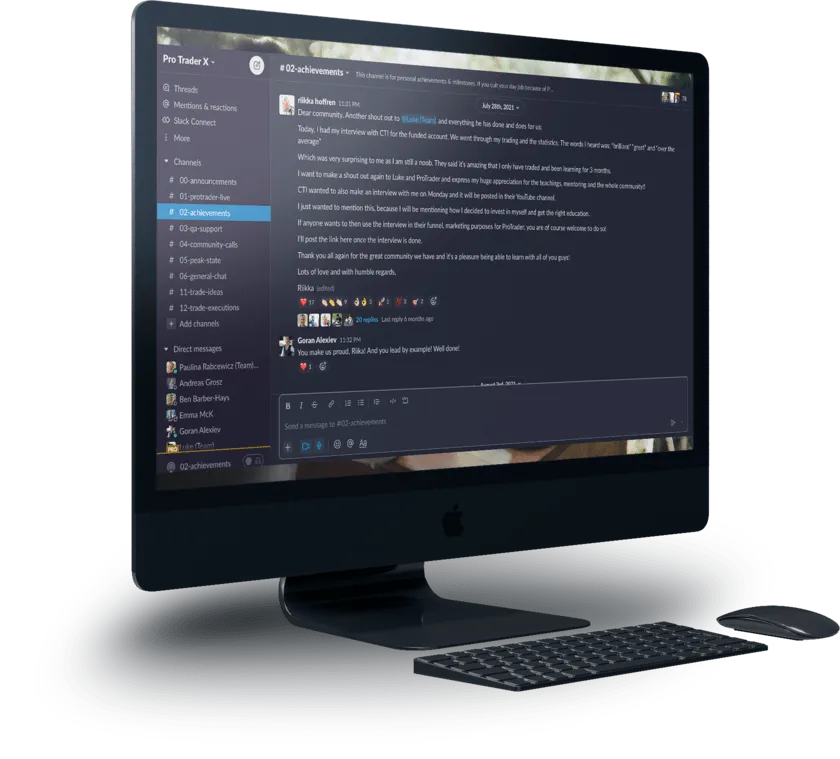
When you join, you'll be invited into our private Slack channel of movers & shakers from all over the world. This incredible group will motivate you, push you, & support you through your life-changing trading journey.
👨💻 WEEKLY & MONTHLY LIVE CALLS
✔ Included in your membership
✅ Weekly Market Forecast
✅ Weekly Roundtable (Live 60 min)
✅ Monthly Community Call (90 min)
✅ Direct Trade Support with Luke & more!

👨💻 WEEKLY & MONTHLY LIVE CALLS
✔ Included in your membership
✅ Weekly Market Review (Recorded)
✅ Weekly Roundtable (Live 60 min)
✅ Weekly Community Call (90 min)
✅ Direct Support with Luke & more!
🎥 PRO TRADER ARCHIVES
✔ Included in your membership
Unlock all previous weekly & monthly live calls & market forecast recordings. Over 60+ hours of value-packed educational videos that will take your trading to the next level!

🔑 GET ULTIMATE ACCESS
"Whether you're an experienced trader who wants to improve your trading results, or are completely new to trading and want to get started the right way with a solid foundation. Pro Trader is what you're looking for."

The Essential Toolbox For Learning To Trade The Financial Markets & Become a Professional Trader
✔ Full Curriculum Available Immediately
$1 for first month then billed monthly at $79/USD.
Cancel at any time.
*Educational content only. Not personal or general financial advice.
We do not know your objectives, financial situation or needs.*

Here's What You're Getting
✔ Pro Trader Curriculum Access
✔ 2 x Beginner Trading Strategies
✔ Trade Ideas & Private Slack Space
✔ Weekly Roundtable (Live)
✔ Weekly Market Review (Recorded)
PLUS: These Extra Bonuses
✔ Weekly Community Call
✔ Pro Trader Recording Archives
✔ 24/7 Live Meeting Room
✔ Special Event Invitations
$99 / month
LIMITED TIME OFFER
ONLY: $79 USD / month
$1 for first month then billed monthly at $79/USD.
Cancel at any time.
*Educational content only. Not personal or general financial advice. We do not know your objectives, financial situation or needs.*

🕊️ MONEY BACK GUARANTEE!

The Essential Toolbox For Learning To Trade The Financial Markets & Become a Professional Trader
TRY NOW WITH 30-DAY REFUND
If you don't feel like Pro Trader is the right fit for you within 30 days you can cancel and request a full refund. No questions asked!
$1 for first month then billed monthly at $79/USD.
Cancel at any time.
*Educational content only. Not personal or general financial advice. We do not know your objectives, financial situation or needs. Trading leveraged products involves risk. Historical results shown are not a reliable indicator of future performance.*
Copyright © Pro Trader X, All rights reserved
